Marine life observation
Aerial imagery for species identification, fauna counts and behavioural observations.

Wildlife surveys, habitat mapping, environmental reporting and disaster response.
 View image +
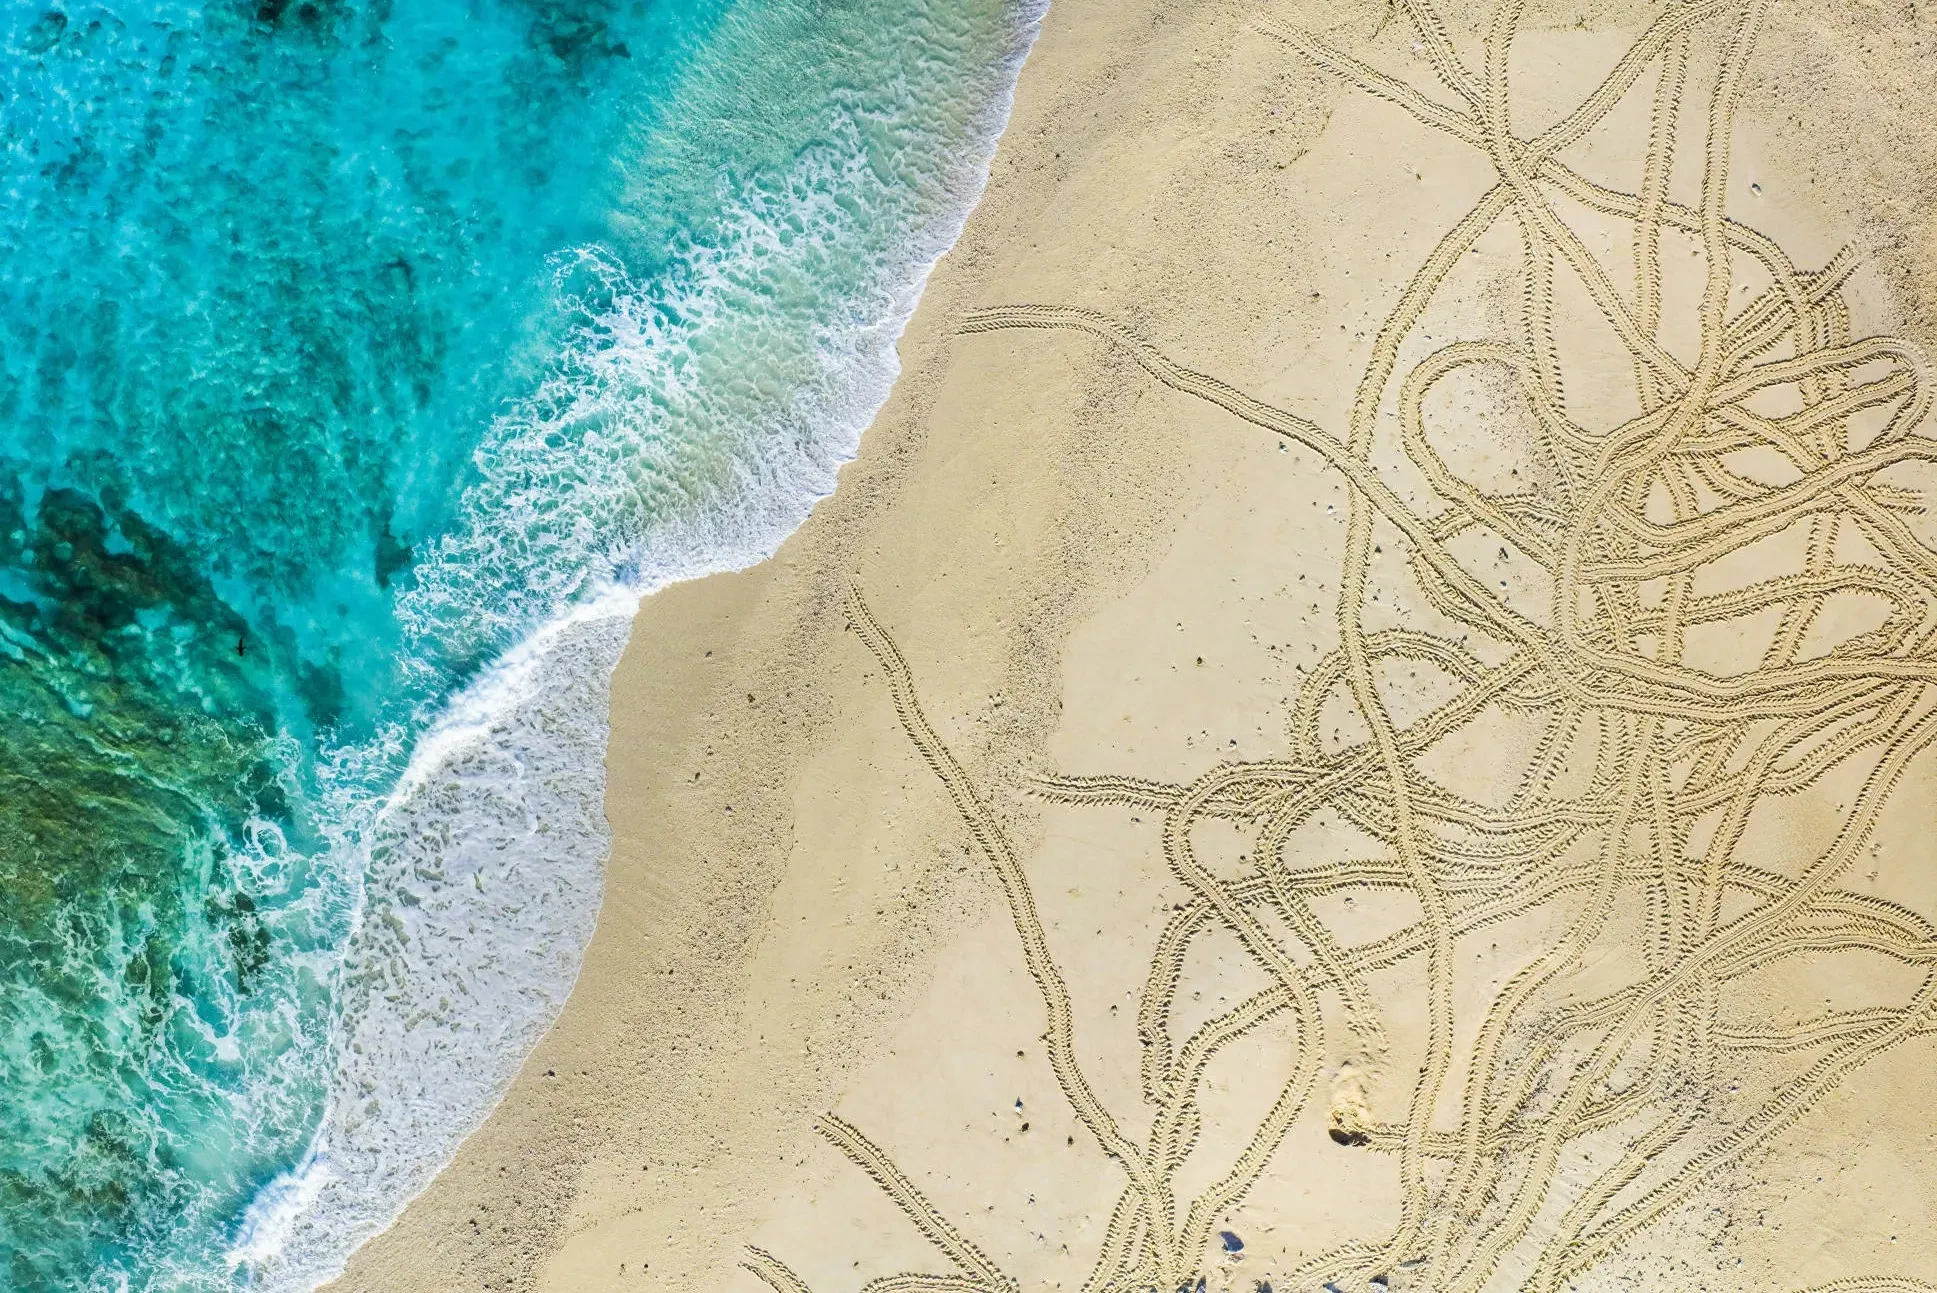
We specialise in complex marine science operations including large-scale coastal corridor surveys, marine detection and observational reporting. We have authored papers on marine mammal photogrammetry and create customised camera systems for specialist operations.
Using aerial imagery to observe and document marine life, including turtles, dugongs, marine mammals, birds and other aquatic species, for research and conservation purposes. This includes species identification, fauna counts, direction and qualifiers.
Georeferenced imagery · Wildlife observations · GIS layers · Statistical reports
Aerial imagery for species identification, fauna counts and behavioural observations.
Monitoring coastal areas to assess erosion, shoreline changes and coastal infrastructure impacts.
Comparing current survey data with historical data to assess long-term changes in marine environments.
Working with marine scientists, conservationists, government agencies and industry to provide data for marine research.
 View image +
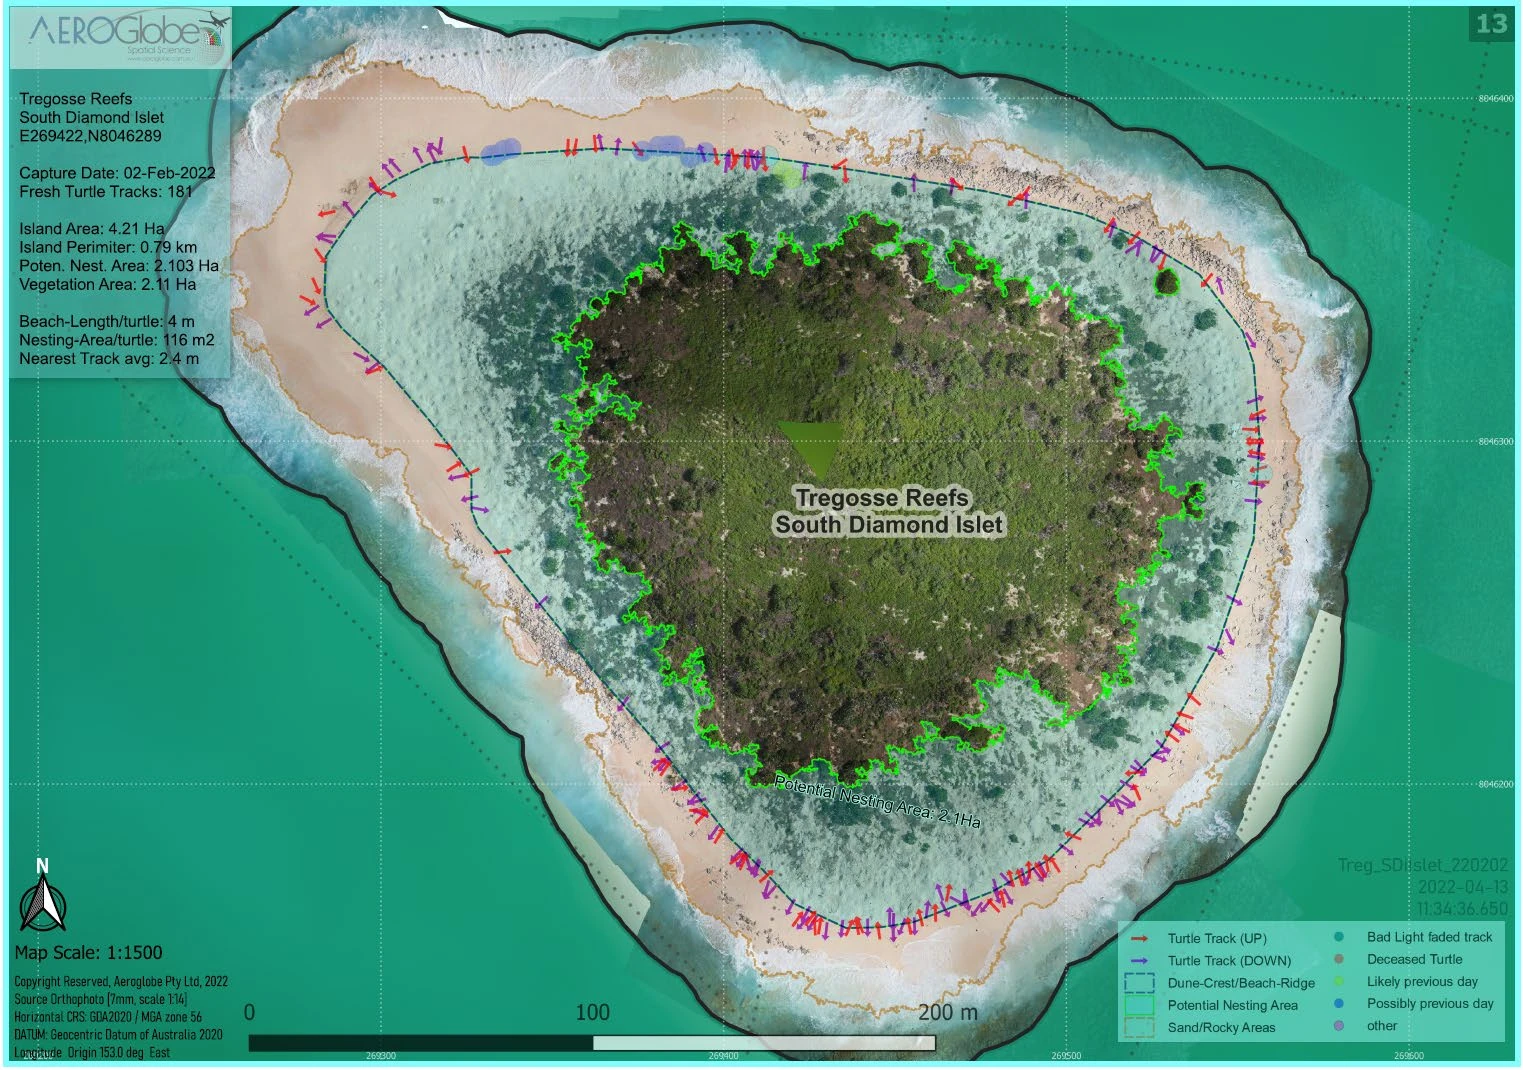
Ultra-high-resolution ortho-photomosaics and digital surface models are used to derive summary mapping products. The mapping outputs collate data from the raw aerial survey, turtle-track activity and area-based statistics into cartographic georeferenced map sets.
Maps include thematically coloured turtle tracks, areas of sand and rock, vegetation and areas available for potential turtle nesting. Summary statistics for each islet or cay provide opportunities for more detailed examination of similarities and differences between sites.
GeoPDF · GeoTIFF · Vectors · Metadata · Secure Maps access
Track sections, width, direction and classification linked to the source imagery.
AI-assisted detection and specialist review, with bird observations and colony-level mapping.
Canopy cover and height, dune crests, beach slope and other habitat attributes.
GeoPDF map sheets, GIS-ready rasters and vectors, metadata and secure browser-based imagery access.
 View image +
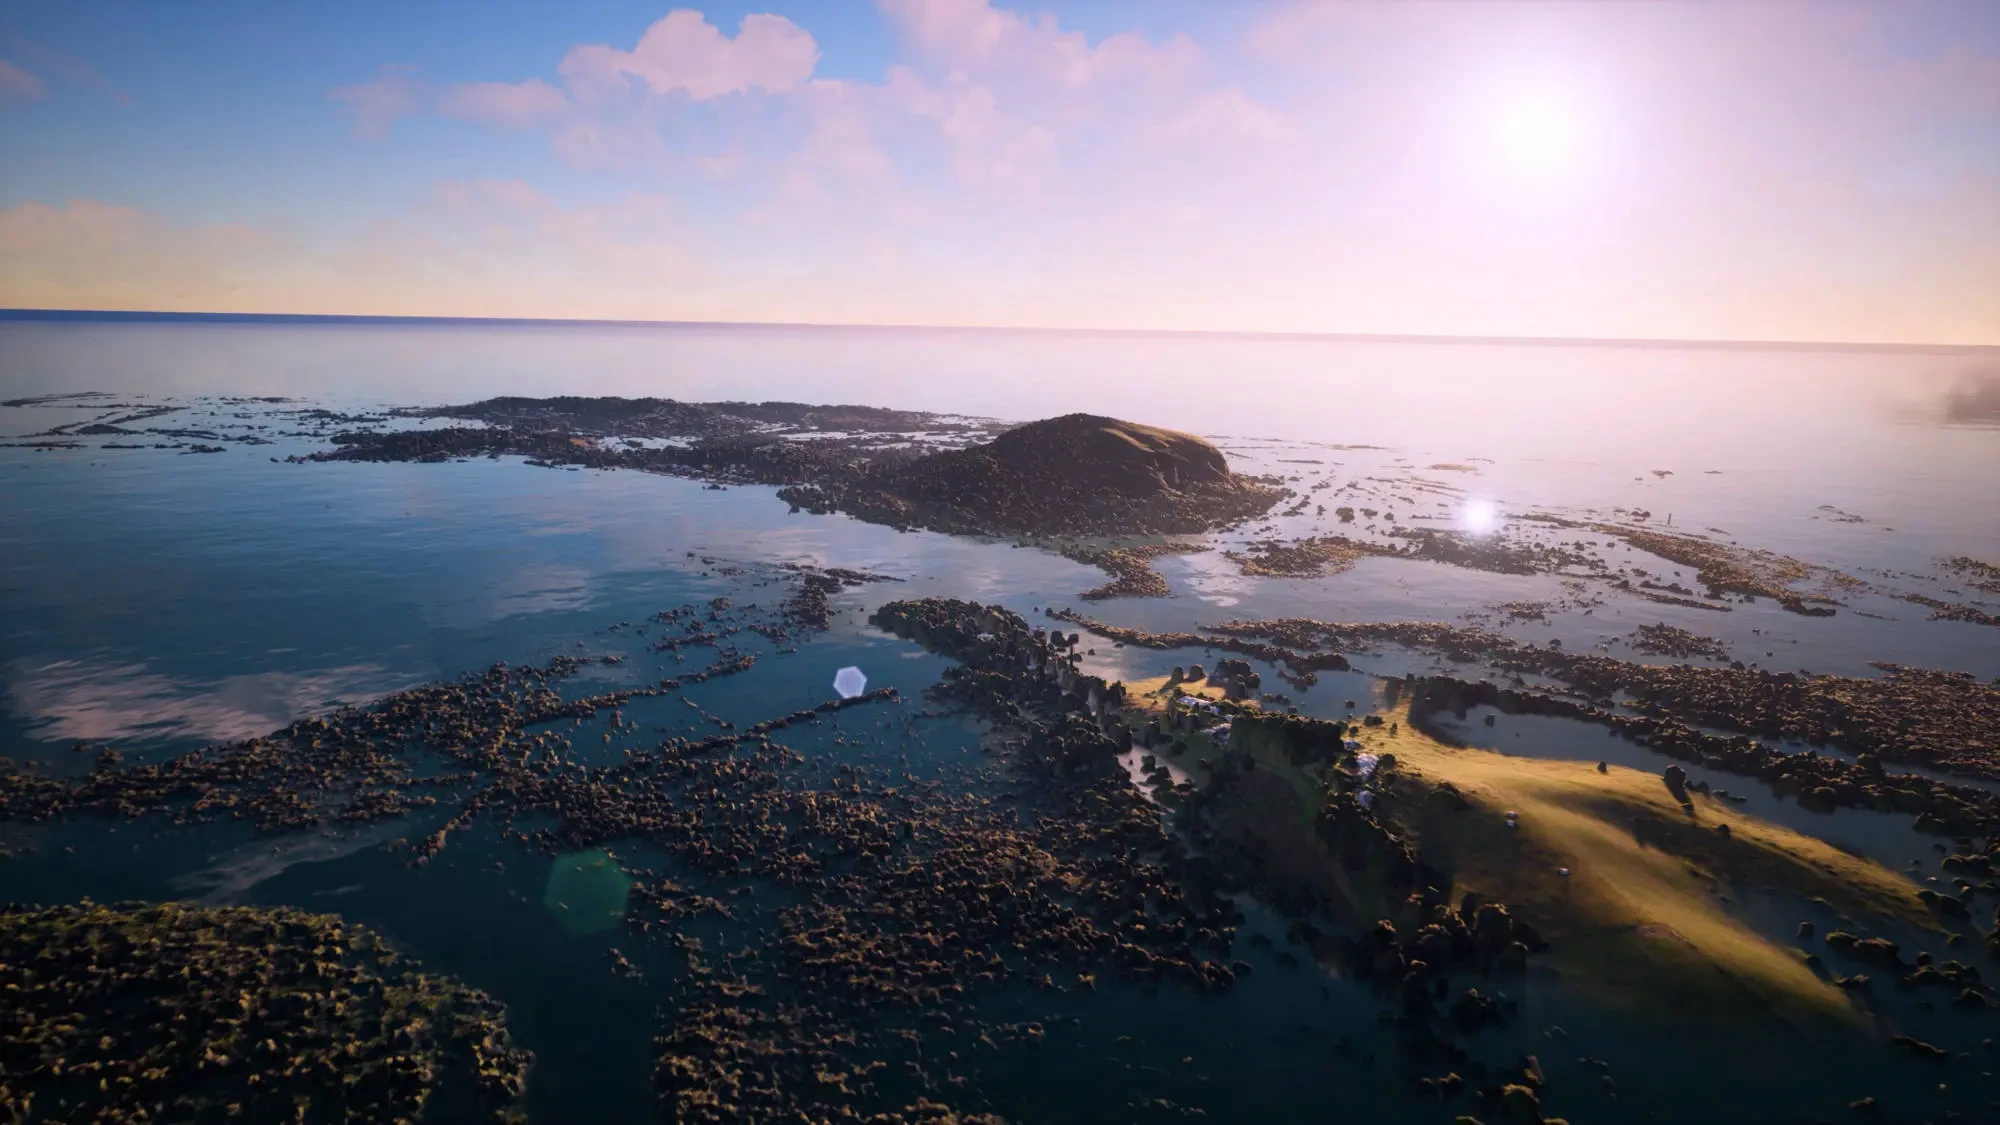
Our disaster-response experience spans floods, cyclones and earthquakes in Australia and New Zealand. Aerial imagery records affected areas and supports assessment and recovery planning.
Terrain models and 3D visualisations help communicate the effects of water levels across a landscape.
Aerial imagery · Orthomosaics · Terrain models · Visualisations
Aerial imagery of inundated areas and landscape change.
Spatial records of affected communities and environments.
Photogrammetry and repeat imagery for recovery planning.
3D terrain and built-form models for communicating scenarios.
 View image +
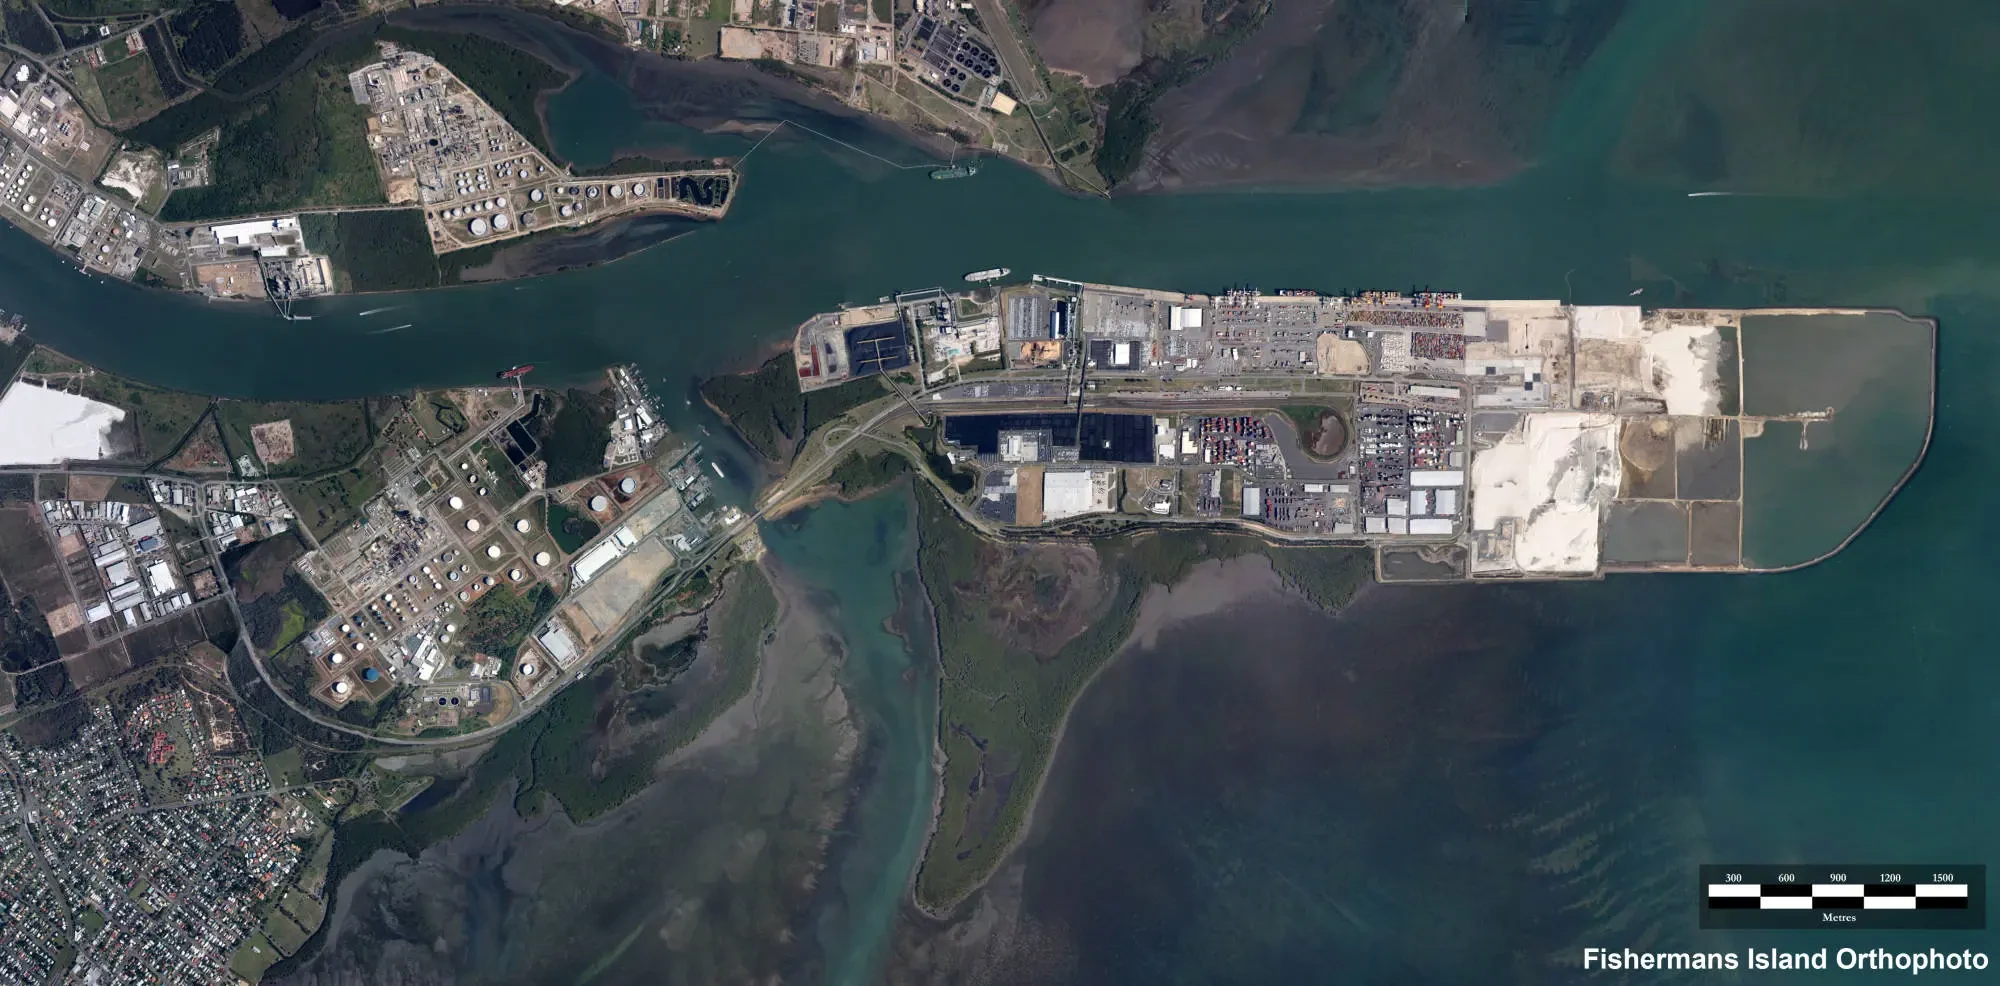
High-resolution, georeferenced images record construction progress and changes in landscapes and urban areas over time. Repeat aerial mapping provides a visual record for project teams, environmental agencies and planners.
Our work includes construction-progress aerials and maps, coastal management, urban development, agricultural mapping and disaster-response surveys.
Repeat orthomosaics · GIS comparisons · Maps · Visualisations
Repeat imagery and maps showing changes across a site.
Shoreline and habitat comparisons between surveys.
Spatial records of land use, infrastructure and vegetation.
Aerial imagery for assessment and recovery planning.
 View image +
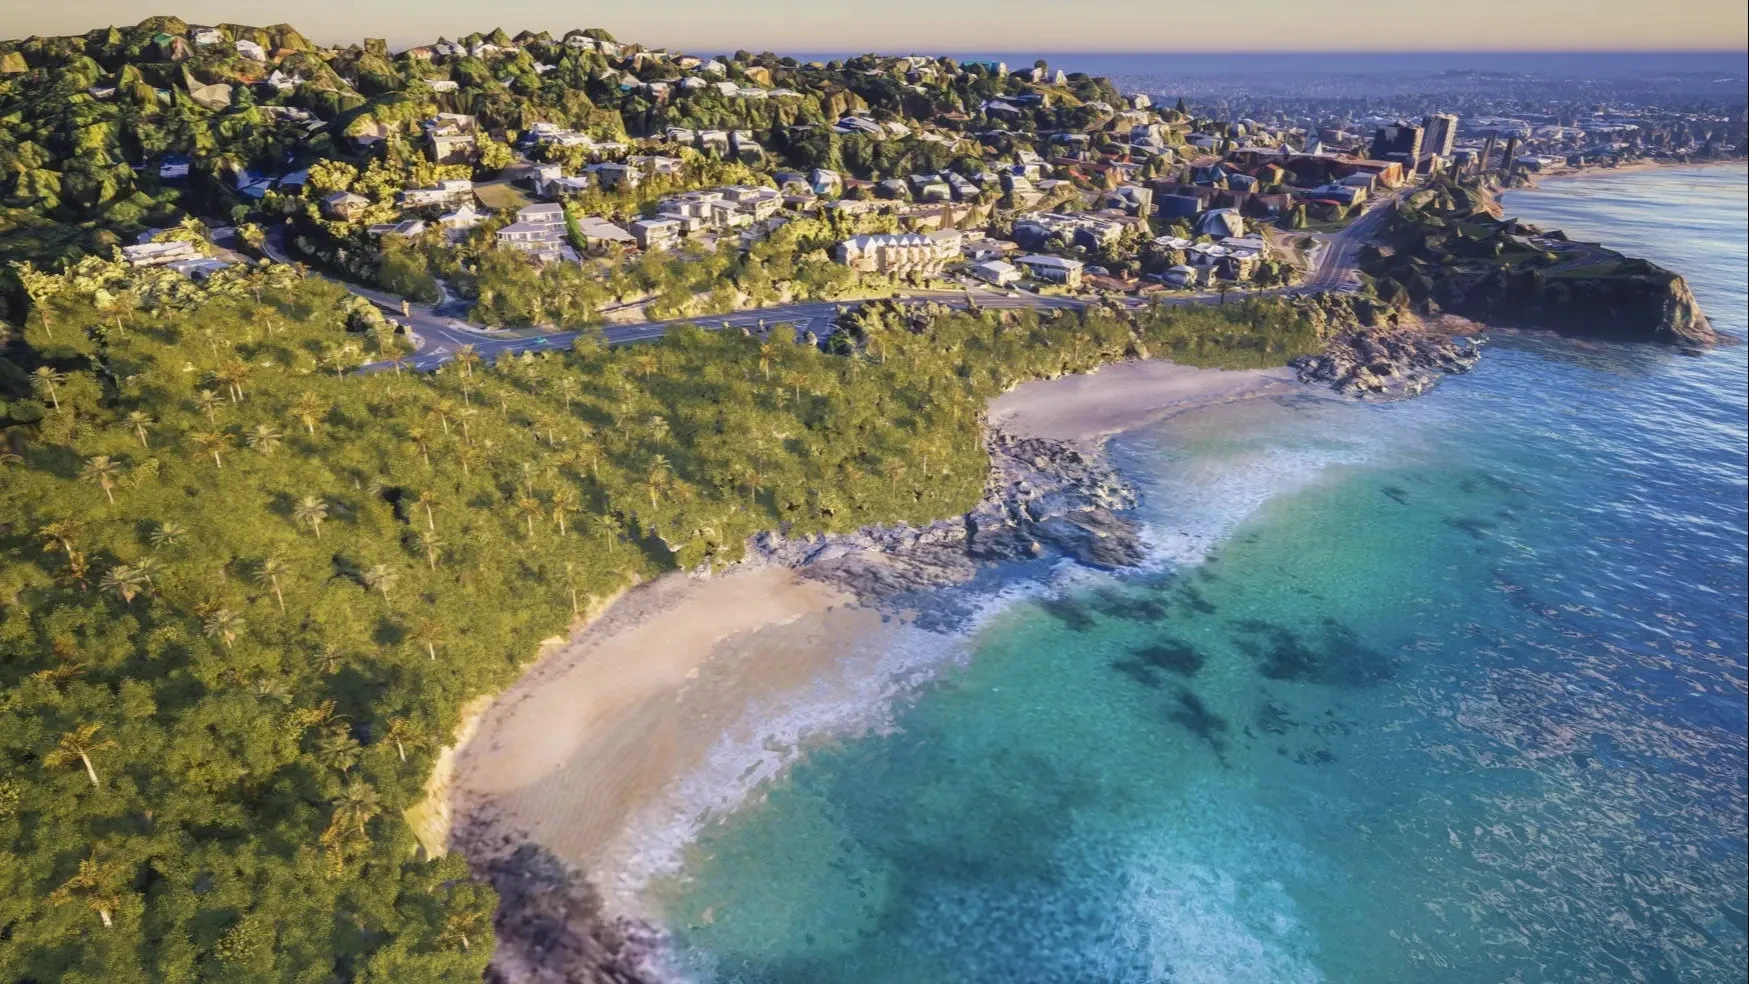
We combine architectural models with real-world photogrammetry for replication of views, site context and project visualisation. Aerial models cover cities, regions, towns, mines and construction sites.
Our infrastructure experience includes runway-construction photogrammetry, volumetric measurement, height measurement and asset capture.
OBJ · Point clouds · Surface models · Volume reports
Terrain and built-form models for architects, designers and project teams.
Volumetric measurements and surface comparisons.
Classified point-cloud products for geospatial and design workflows.
Aerial models as a foundation for visualising water levels and flood scenarios.
 View image +
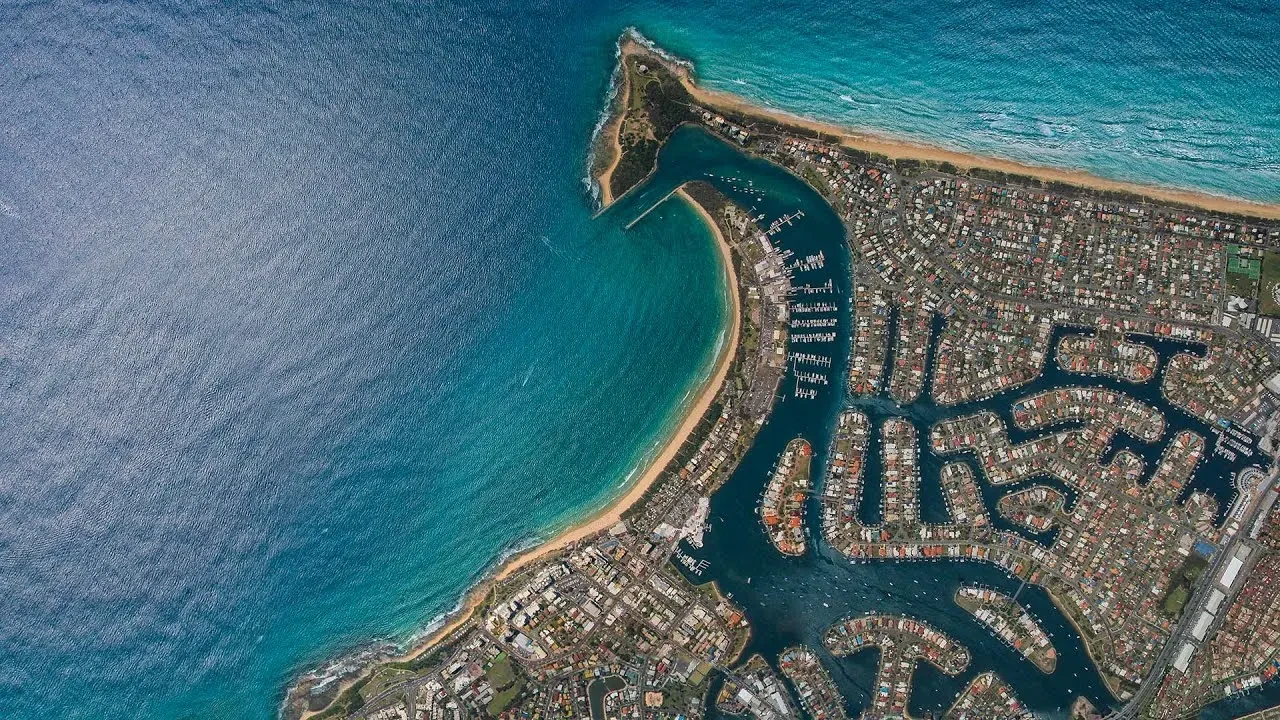
High-resolution ortho-rectified maps provide a true-to-scale representation of the surveyed area. Integrate our aerial survey mapping data directly into your existing workflows and software applications.
From digital elevation models to point clouds, digital area mapping and surface models, we supply aerial survey products for construction, environmental monitoring and urban planning.
GeoTIFF · PDF · DSM / DTM · Point clouds · Shapefile · GeoDatabase
High-resolution aerial imagery for topographic mapping, land use planning and environmental studies.
3D representations of terrain and structures for construction planning, landscape design and environmental studies.
Digital Surface Models (DSMs) and Digital Terrain Models (DTMs) showing surface elevations or bare-earth terrain.
Customised survey analysis and reporting, statistical analysis and trend identification.
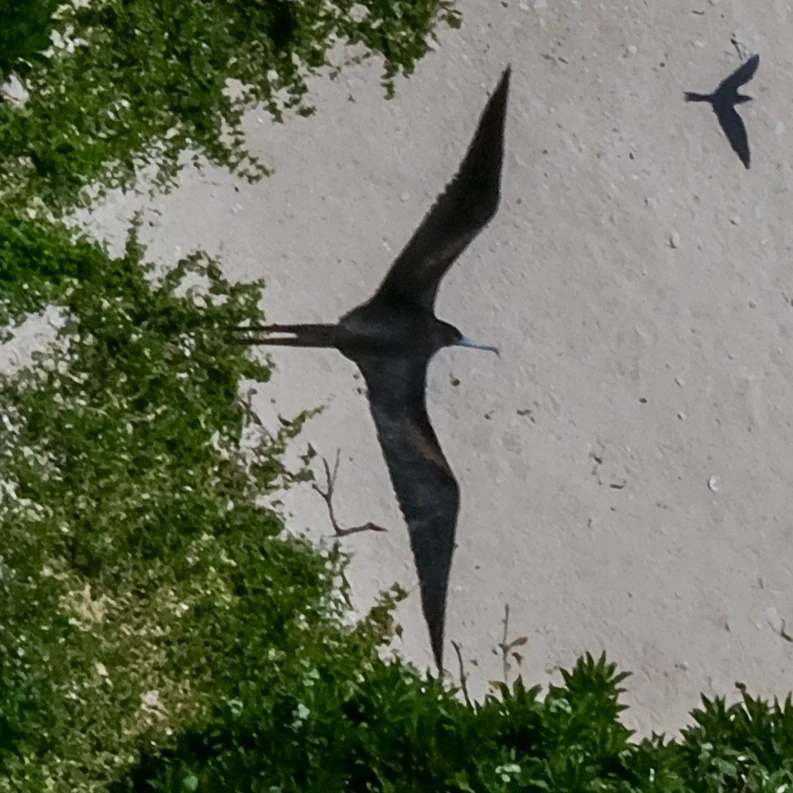
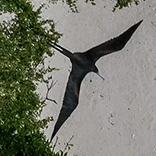
Bird imagery at 7, 28 and 40 mm ground sample distance (GSD).
 View image +
 View image +
 View image +
Ground sample distance is the size of one image pixel on the ground. The examples show how the detail available for species identification changes with image resolution.
Ask a question or request a quote for aerial survey, mapping or environmental analysis.